Stock Project V1
Data analytics platform born to try and disprove a trading theory.
Overview
This project literally started because I had a stock trading theory that I couldn't stop thinking about but also couldn't see the fallacy in it. I felt it was so simple and I am of the mindset that there is no 'Easy, get rich quick' when it comes to the stock market. I spent one weekend to do some historical data analysis just so I could prove myself wrong and stop thinking about it, but the more I looked into it, the more it seemed like the strategy could be profitable. That one weekend didn't end there and I began diving into data analytics and the stock market even more.
Key Details
- Data Ingestion Used Python to gather and prepare market data for analysis
- Custom Algorithm Gotta keep this one a secret sorrrrrry
- Super basic frontend No fancy UI when I just want to see results. Vanilla JavaScript and HTML
The Database
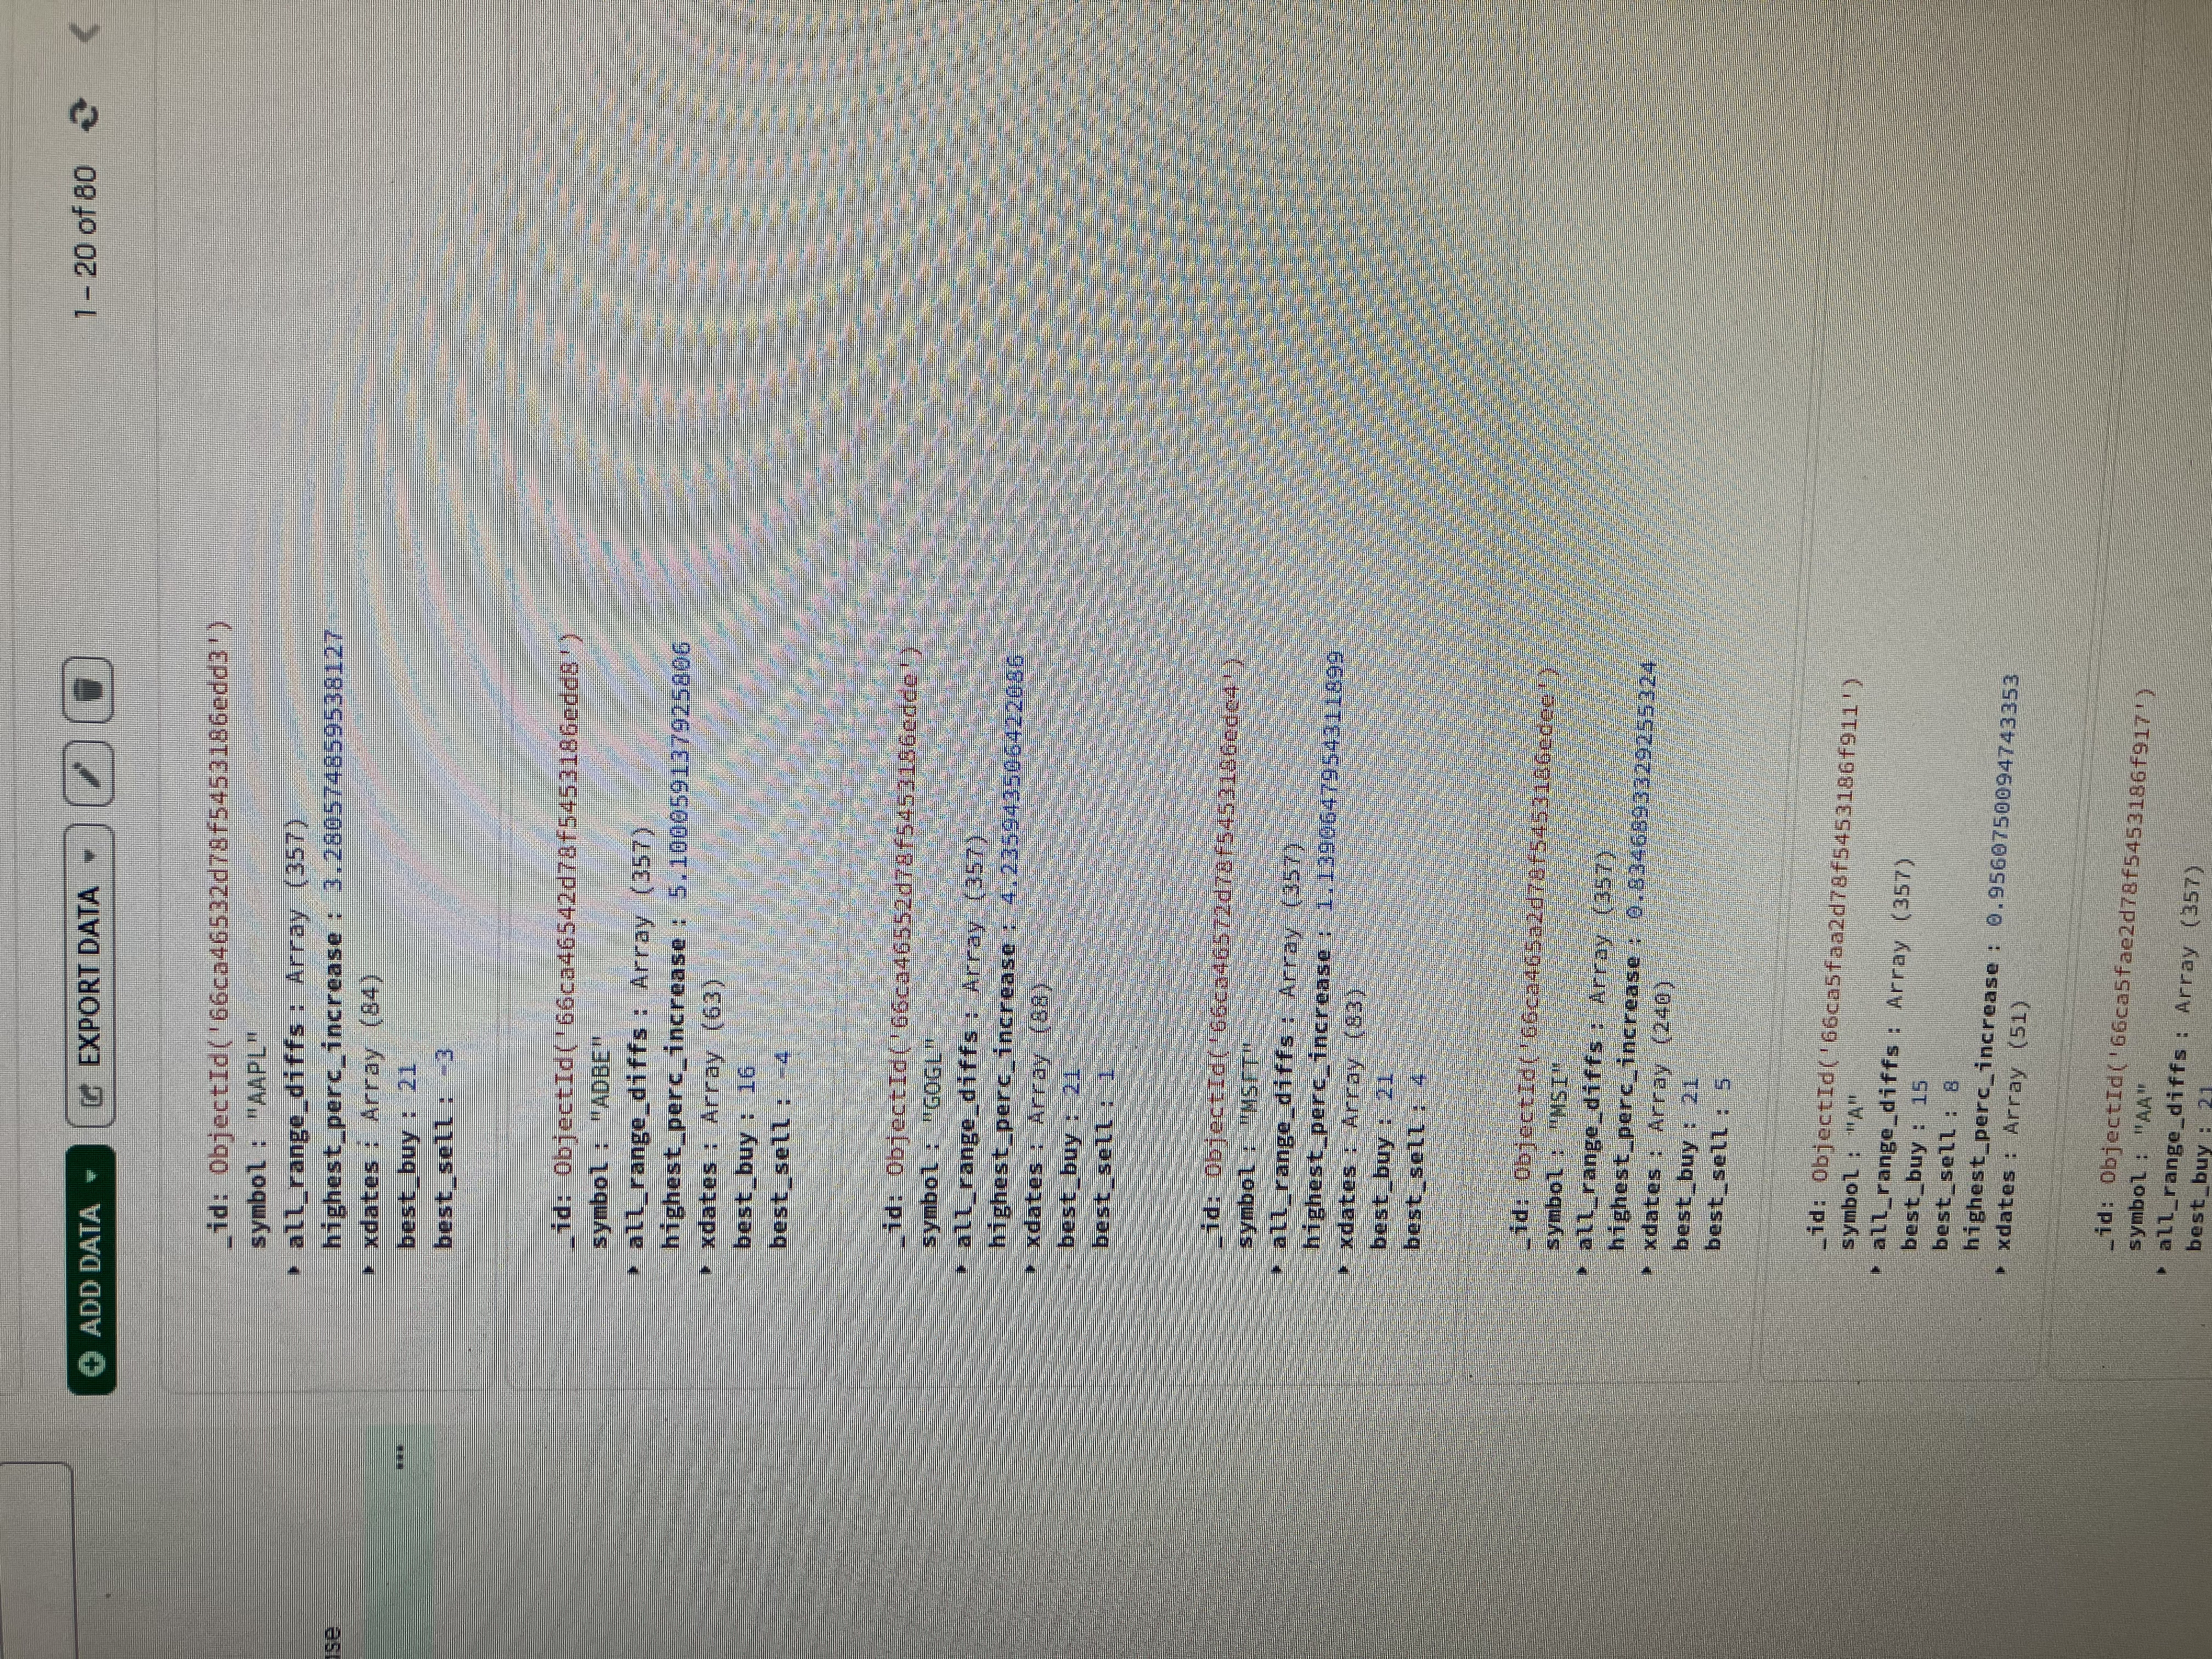
This was one of the first feelings of success. This was the foundation of the data that I was wanting to collect. It had been through my onslaught of Python scripts and successfully populated the database. From here I felt confident to add more parameters and fine-tune my algorithm.
The Analysis
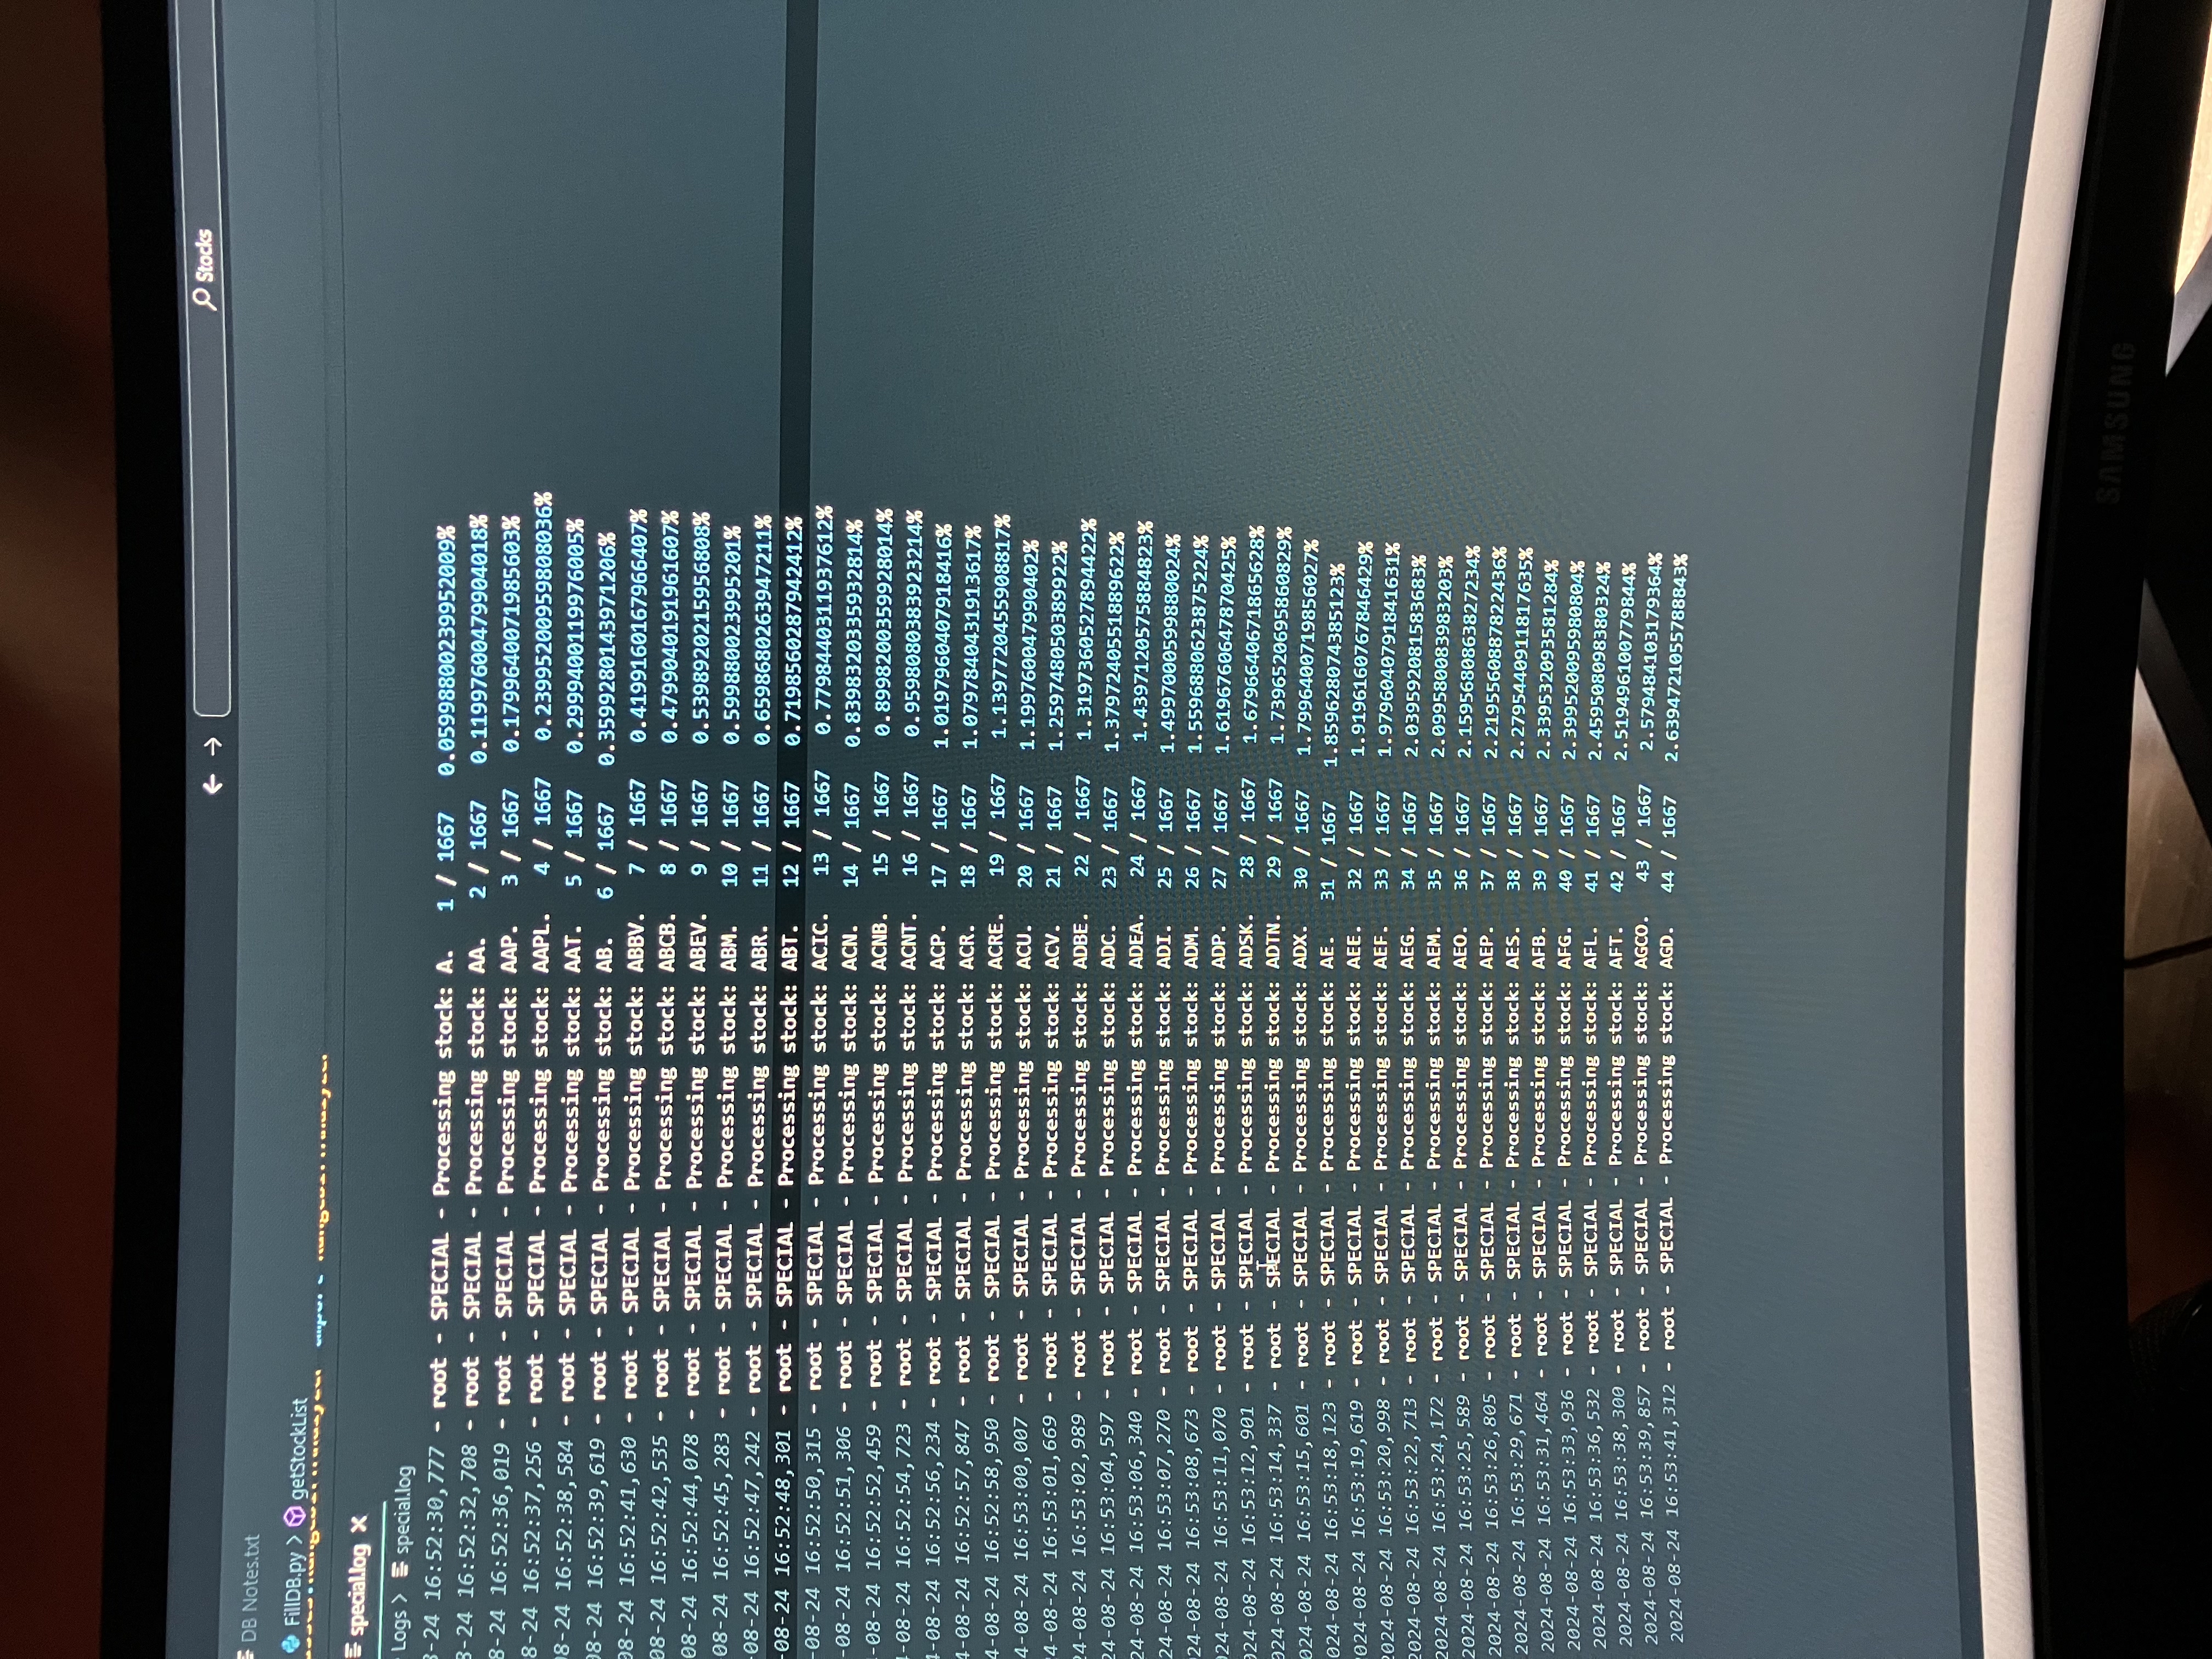
Doing hundreds of thousands of calculations per stock (if not, millions) did cause a bottleneck in terms of time. I added logging to follow the process and at first would just leave my computer to run overnight. Soon I found some major optimizations which cut the time down significantly.
The Frontend
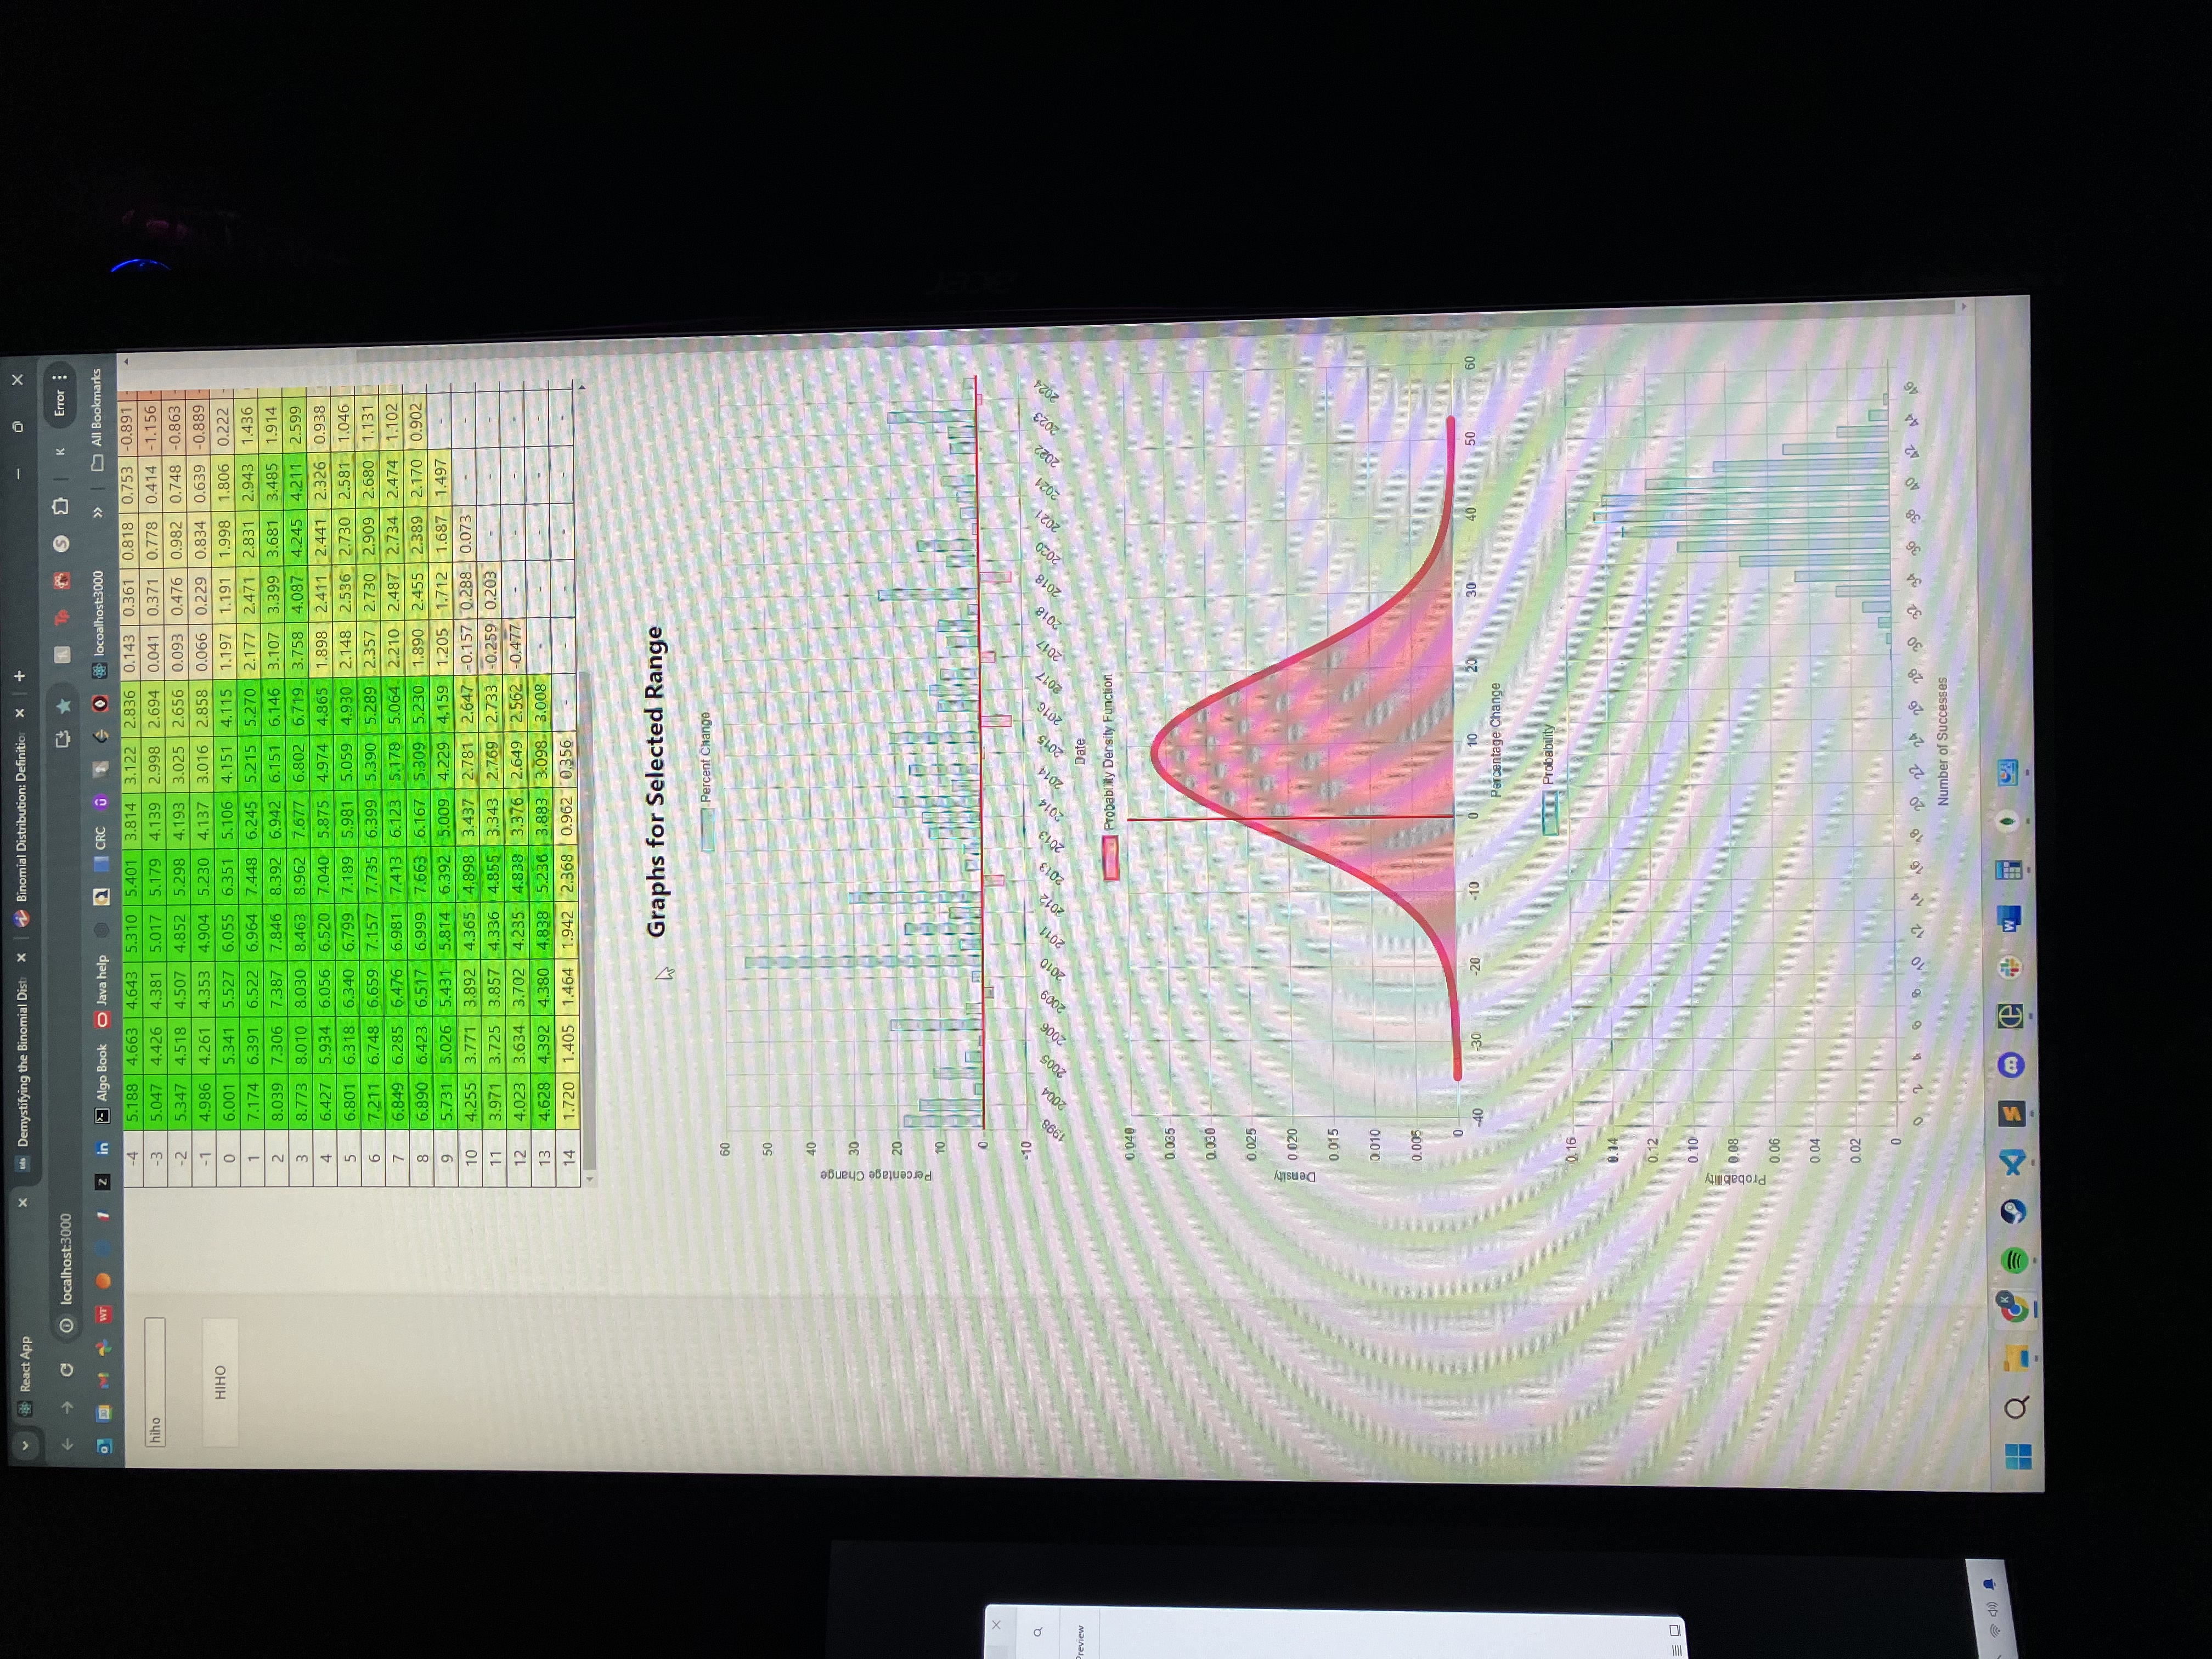
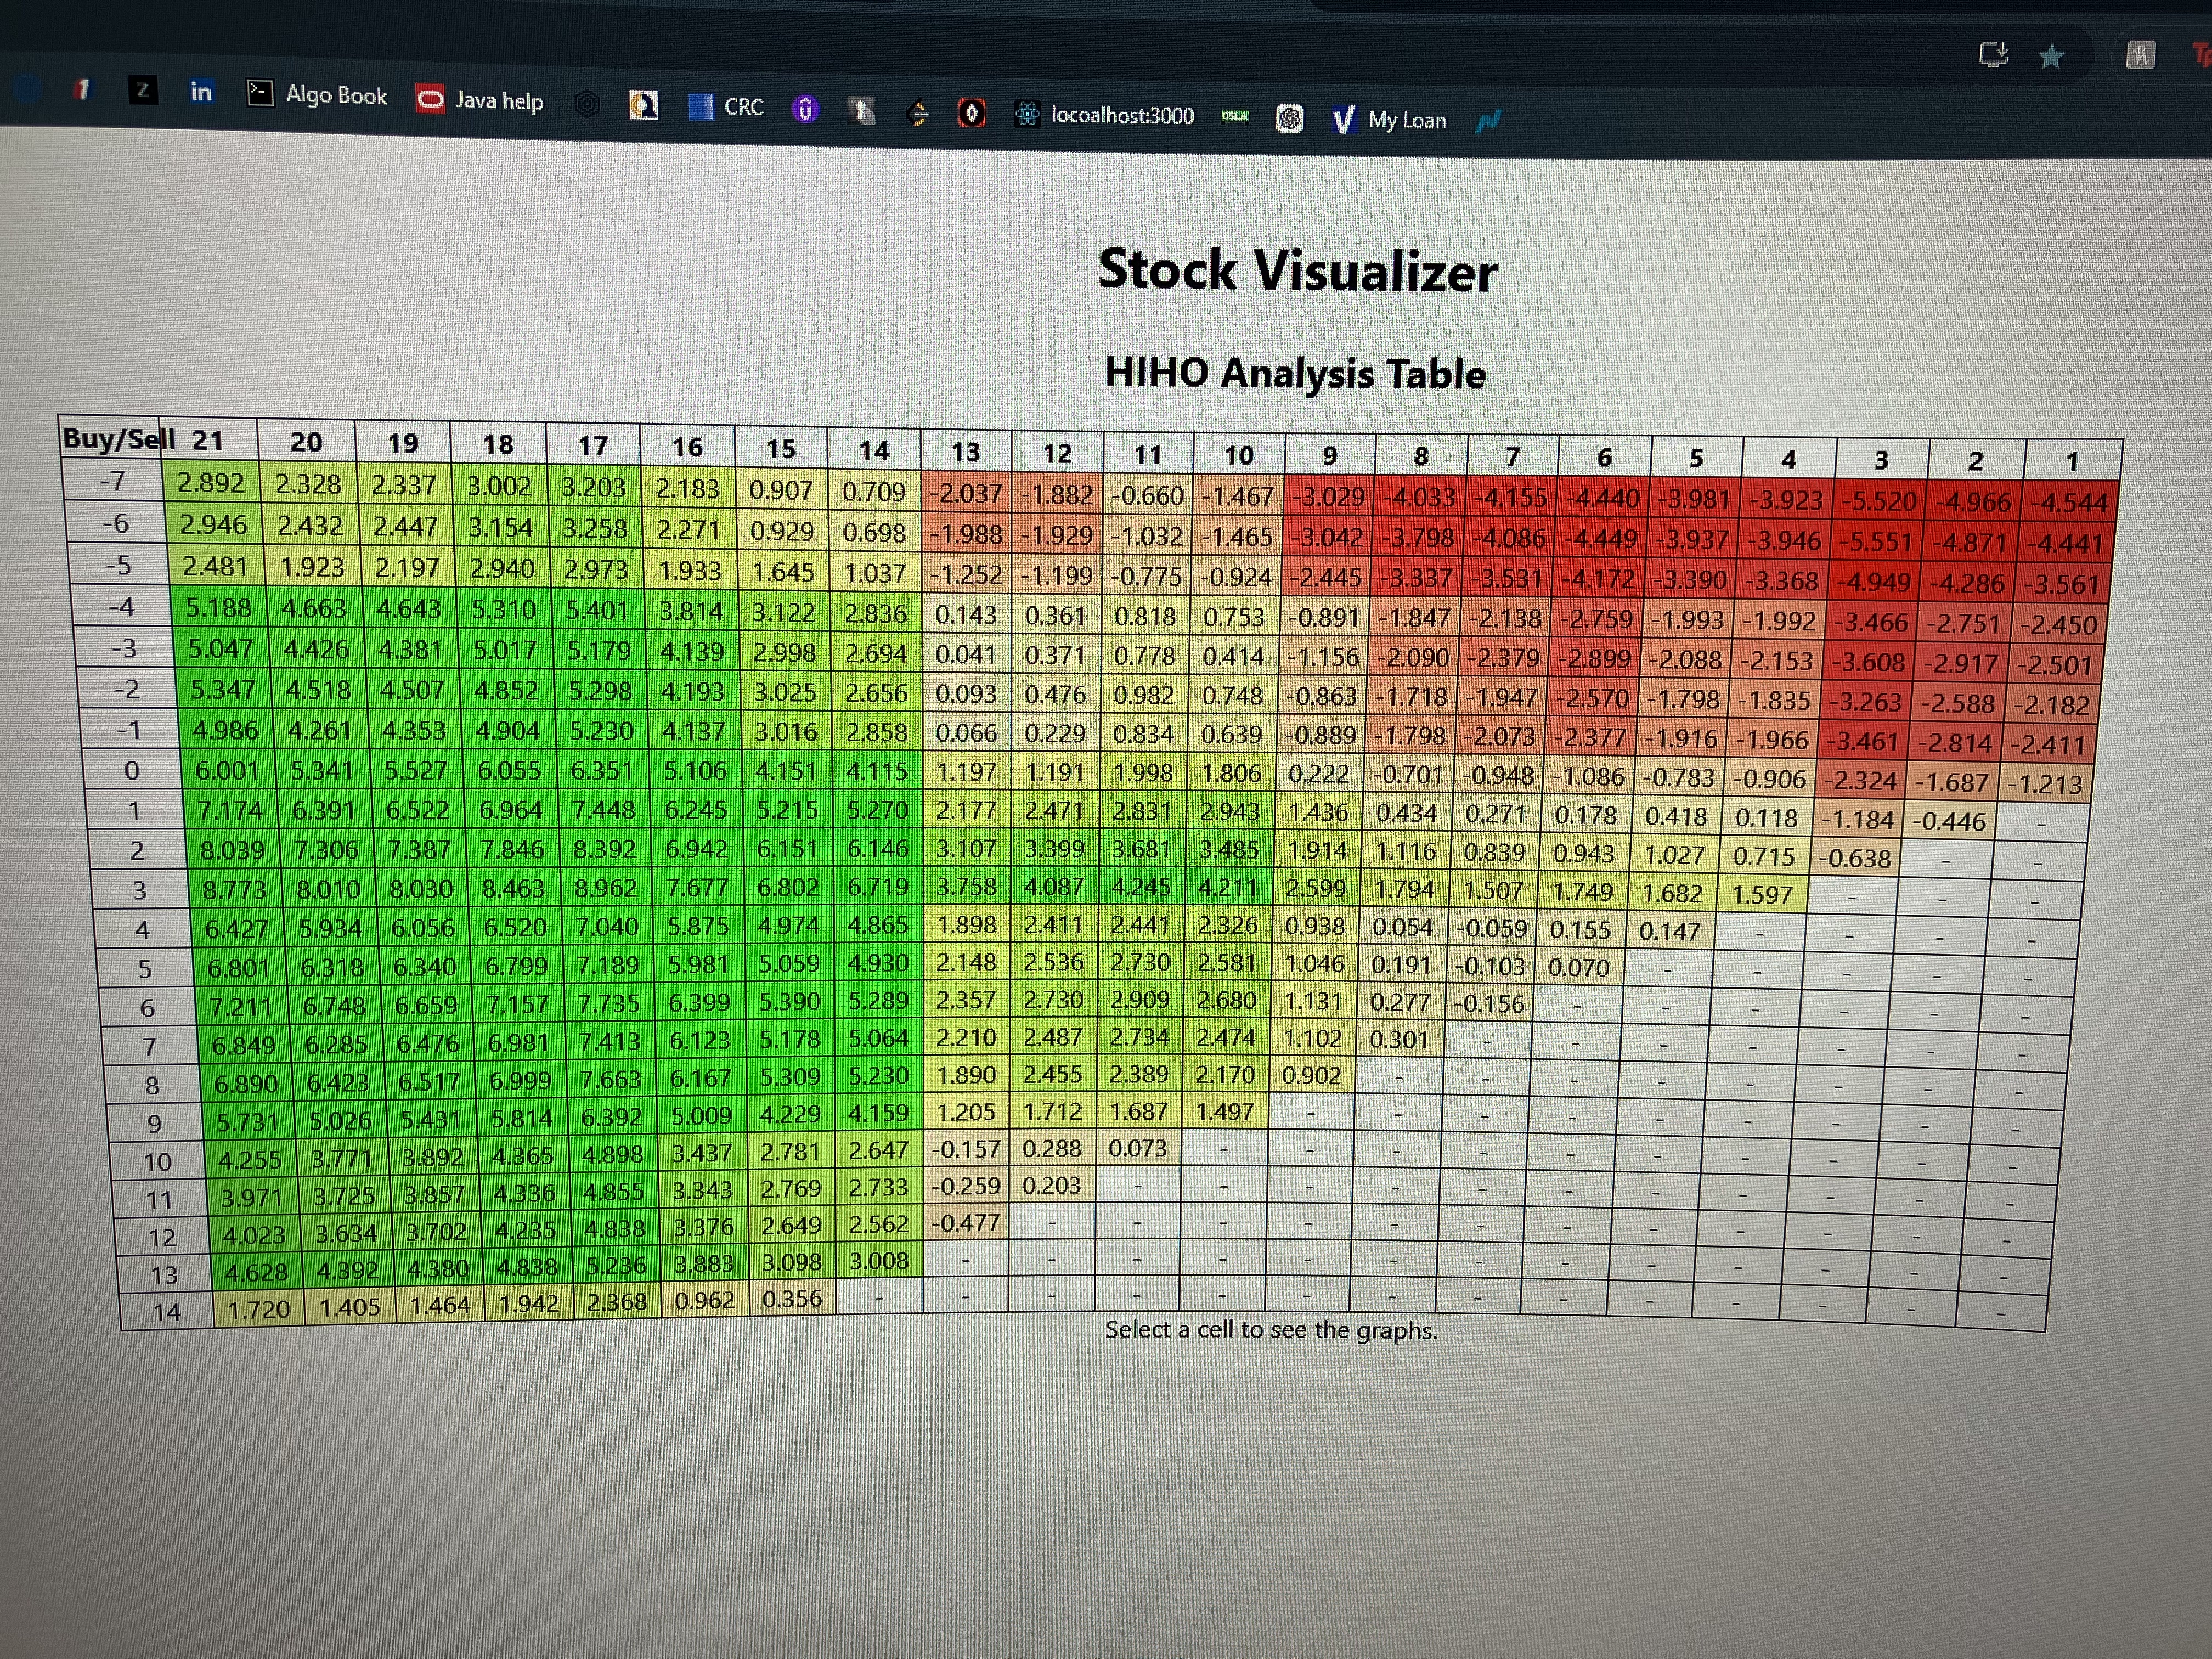
After navigating through MongoDB Compass over and over, I felt like it would be great to easily see the data in a more readable format. I built a simple frontend which helped a ton when it came to analyzing the data and fine-tuning my algorithm.