StockViz V2
Improved backend data, a brilliant frontend, and a new trading Optimizer.
Overview
I had to take a step away from the project for a while because even though I was very interested in it and thought it was profitable, I did not have the time or even the money to invest in it. A year later I came back with a purpose to improve it and to make some real world trades to test my theory out.
Key Upgrades
- Advanced Frontend Completely overhauled the dashboard UI
- Improved Efficiency Runs analytics in a fraction of the time
- Trade Optimizer New entry/exit module
Architecture Stack
- Python // FastAPI
- MongoDB
- React + Vite
- Pandas & NumPy
- Tailwind CSS
Improved Frontend
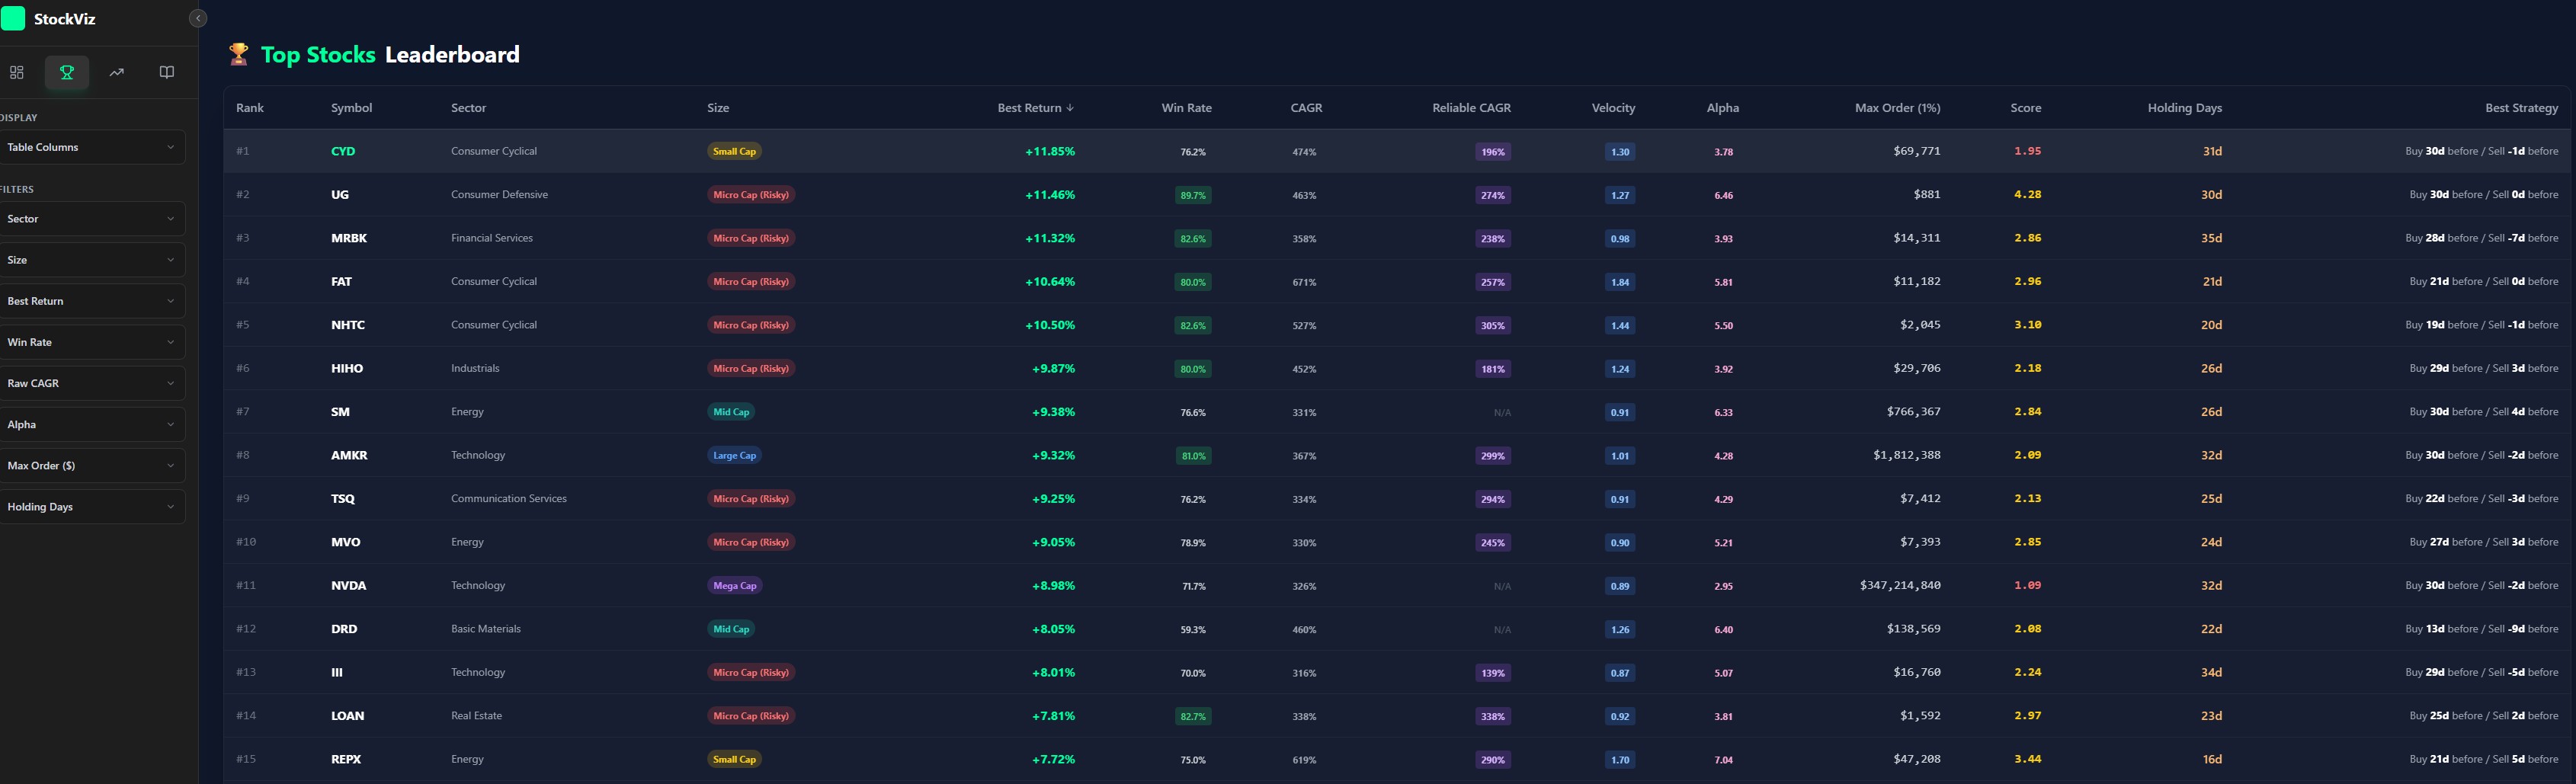
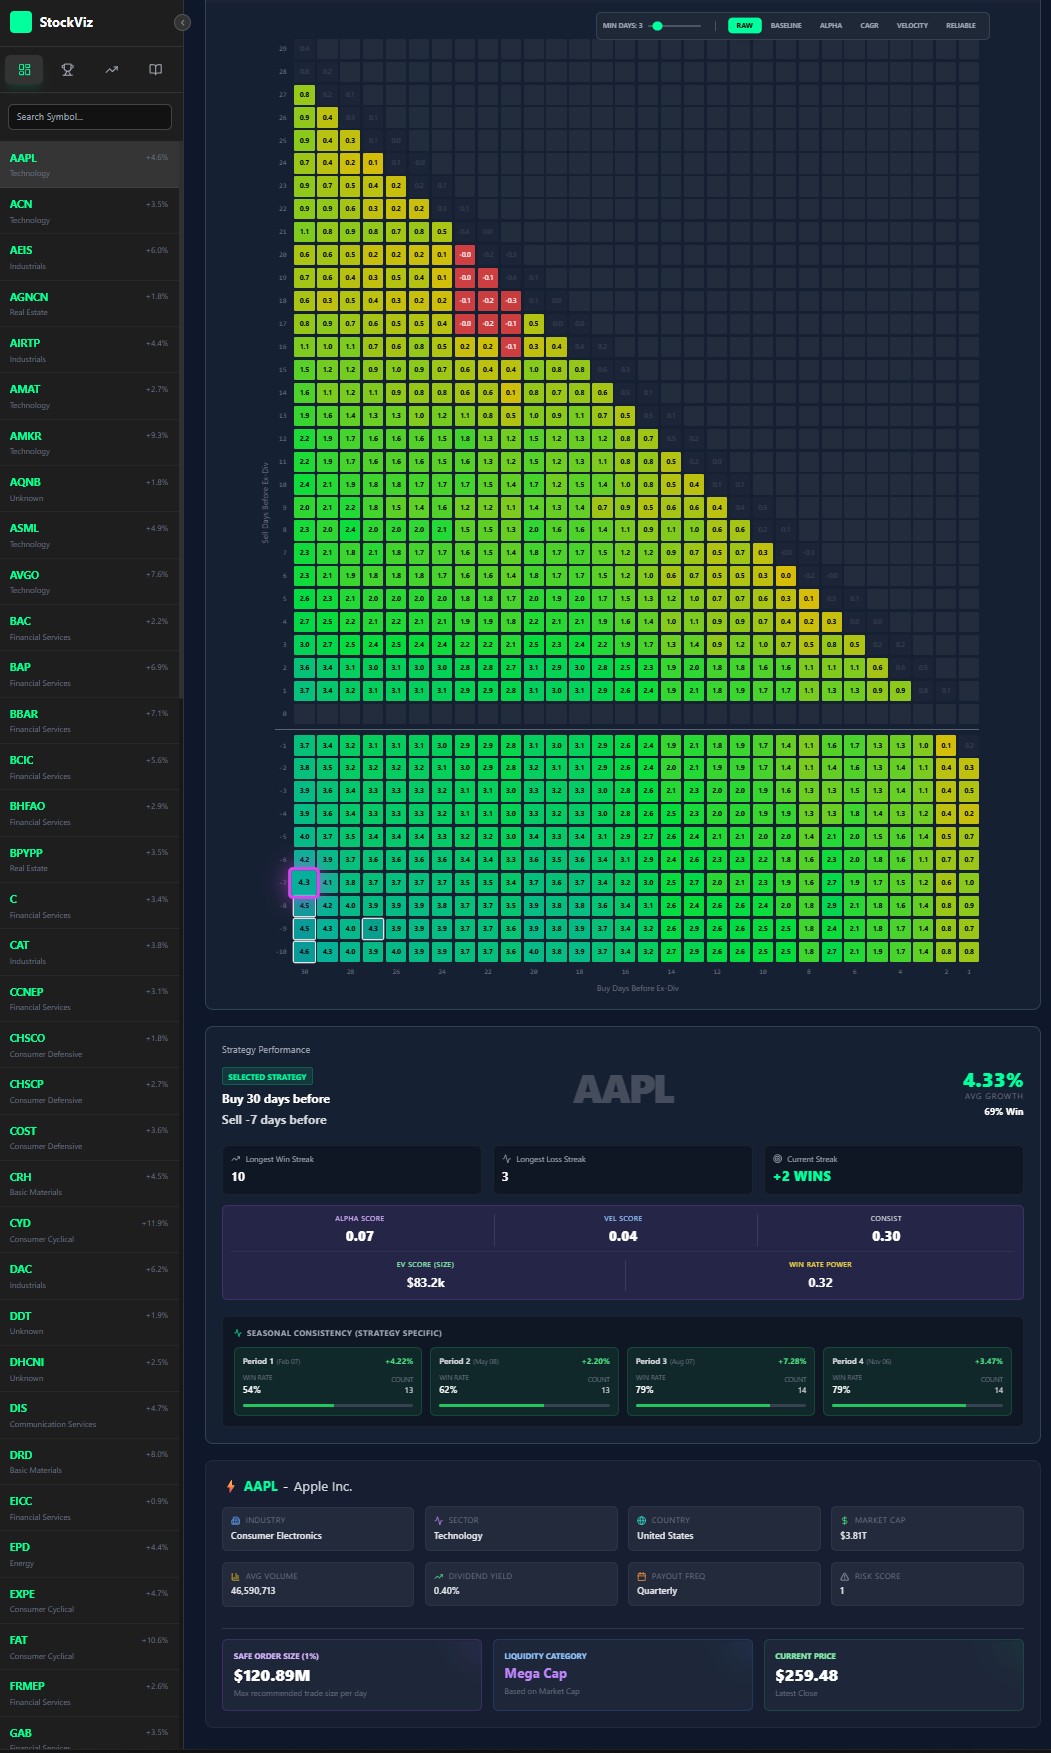
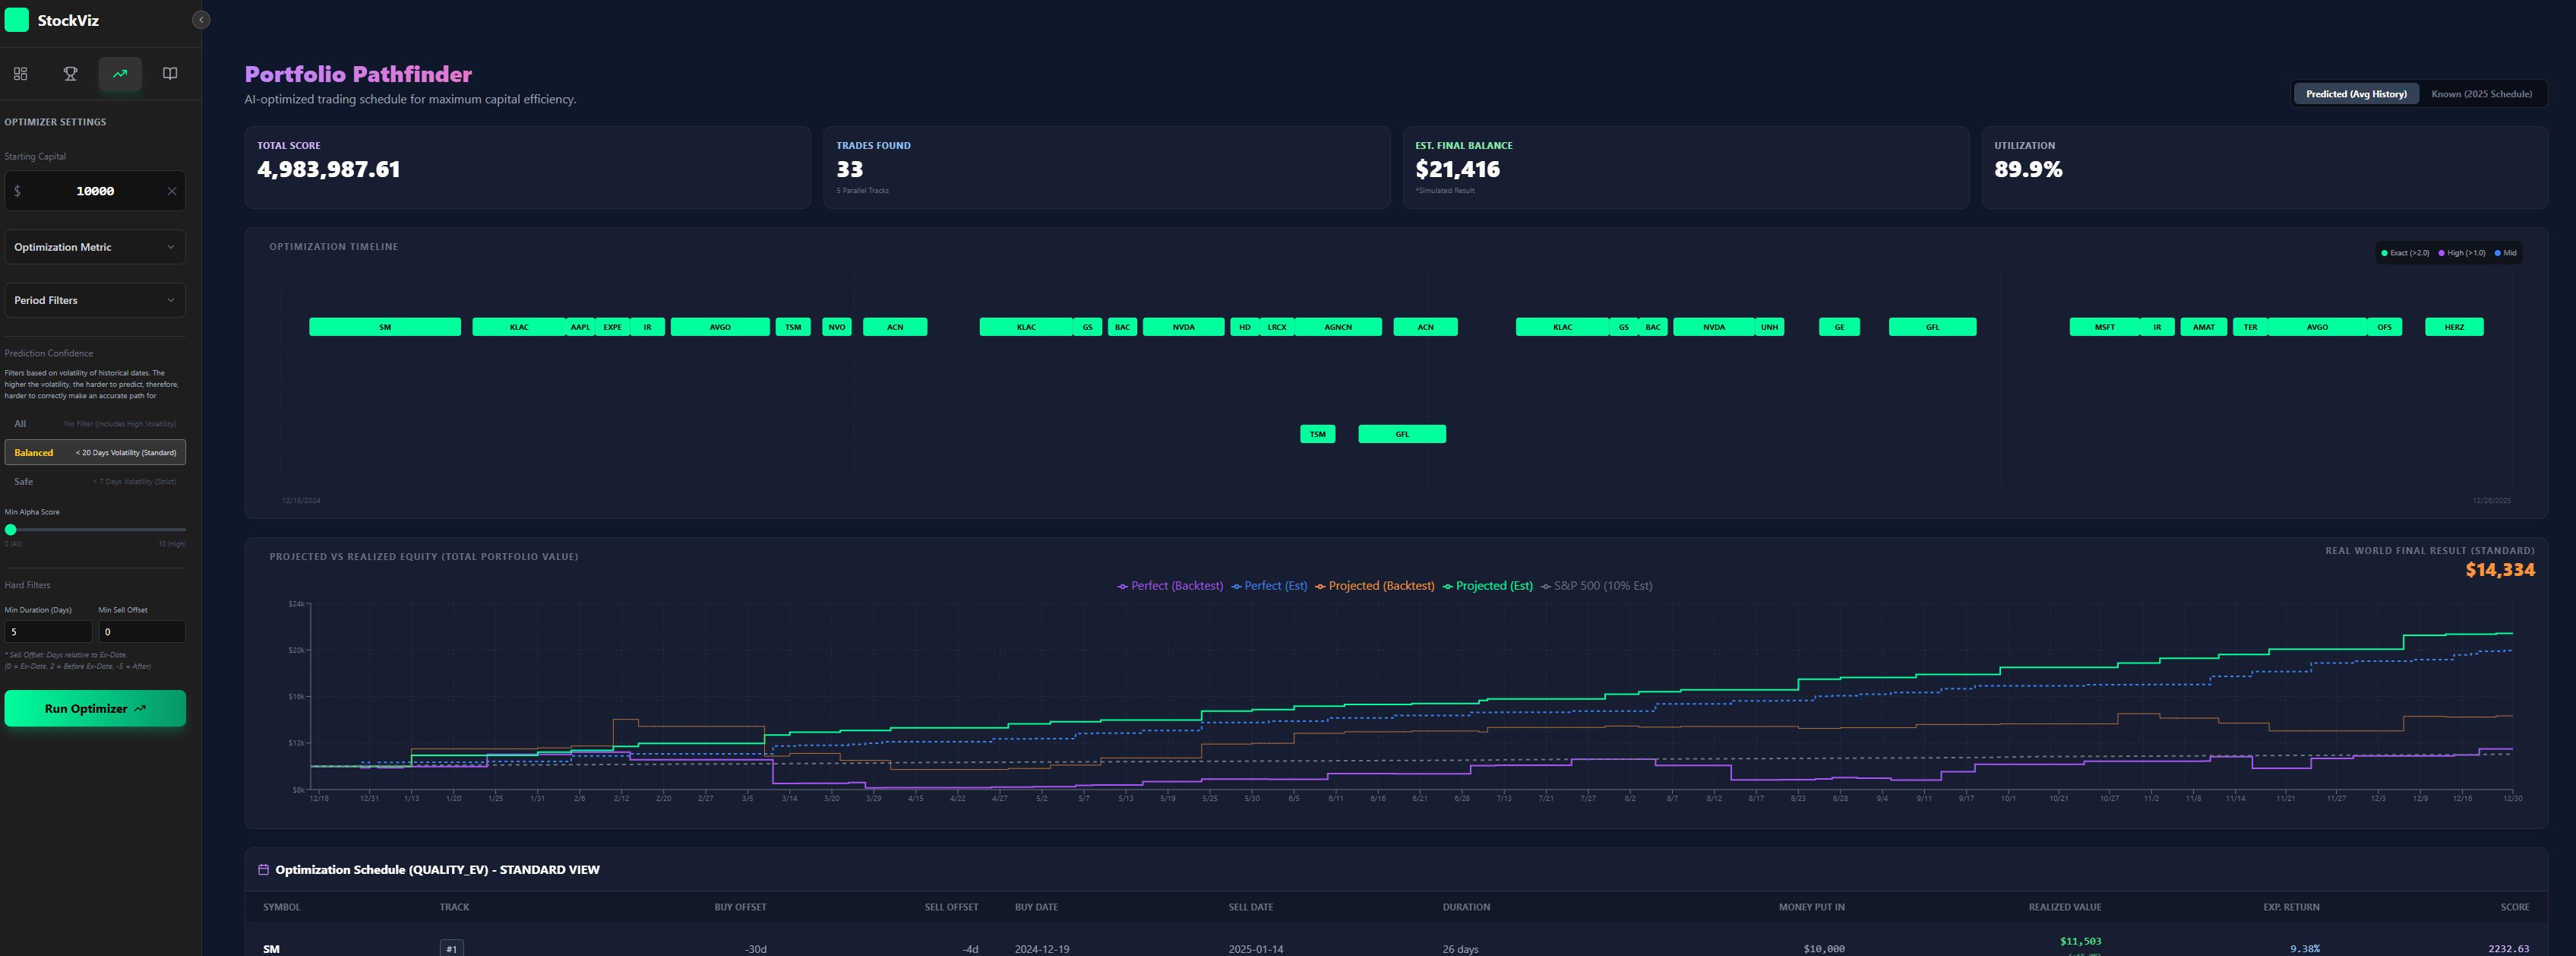
To point out the obvious, the front end is completely differnt and better by 1000%. Other than the clean look, more details have been added. The heatmap cells are clickable which will then populate the data below. That is just the home. There are also two new pages. One that simply ranks the stocks based on what datapoint you want to sort by (Win Rate, Best return, Holding Days, etc.). The other page is the Trade Optimizer which is explained next.
The Trade Optimizer
All of the data analysis wouldn't mean much if it didn't culminate to something. The Trade Optimizers goal is to set forth a trading agenda for the future. There are mulitple "Scores" I give a trade and this optimizer looks at the route for following the best trader per score. It then can compare to how those trades would have done in previous years. This is a huge step forward with the project because this helps tell me if different strategies are reliable or if they are random chance.
Additional Media